Operations
Know which units are off plan before the day ends.
Sales, labor and speed of service side by side, by unit, region and daypart, on the same numbers your finance team closes on.
Before and after
An operations week, before and with Mirus.
Less time reconciling numbers. More time running the business.
Today
Nine tabs by 9amA morning spent assembling yesterday
One region at a timeNo like-for-like across concepts
Yesterday, tomorrowExceptions found a week late
With Mirus
One view by 8amUsually posted within the hour
All units, one gridRegion, concept and daypart in one place
Told, not searchedAlerts name the unit and the gap
Capabilities
What you get
Which employees should work?
Labor against forecast sales by daypart, unit by unit.
When will traffic ramp up?
Guest count and check average by daypart across the estate.
Who's stealing, and how?
Voids, discounts, comps and deletes ranked by unit and employee.
The questions this seat asks
- 01Which five units are furthest off plan this week?
- 02Where is prime cost above its region?
- 03Which dayparts lost traffic against last year?
- 04Which employees ring the most voids per shift?
- 05Did the new schedule change labor percent?
Screen
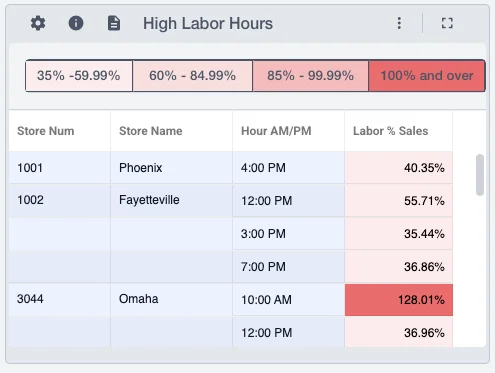
The hours labor ran high, store by store.
Sample data
“It's like an alarm clock for your data, for the important stuff.”

Director of IT / PurchasingTumbleweed Tex Mex Grill & Margarita Bar
Related reading
- StoryException-based alerts that cut comps and deletes by over 2 percentage points of P&L, especially in the first 2 years.Tumbleweed Tex Mex Grill & Margarita Bar
- WebinarRestaurant loss prevention best practicesMirus NOW, Q3 2025
- StoryFrom about six months to get advanced in Cognos to running Mirus reports in a day or two, across two Texas concepts.Willie's Restaurants
- GuideThree basics of harnessing restaurant big datamirus.com
- WebinarRestaurant data analytics best practicesMirus NOW, Q2 2025
See it against your own systems.
A scoped demo built on your POS, labor and accounting feeds: not a generic walkthrough.